LiveNA Configuration
LiveNA is a big data AIOps platform that applies machine learning and heuristics to LiveNX datasets for advanced anomaly detection, predictive analytics for deeper network understanding.
Its role in the LiveAction portfolio is to provide “expert in the box” insights. It accomplished this by baselining and trending what is normal in a network, detecting anomalies, and correlating events for deeper network and application performance insights.
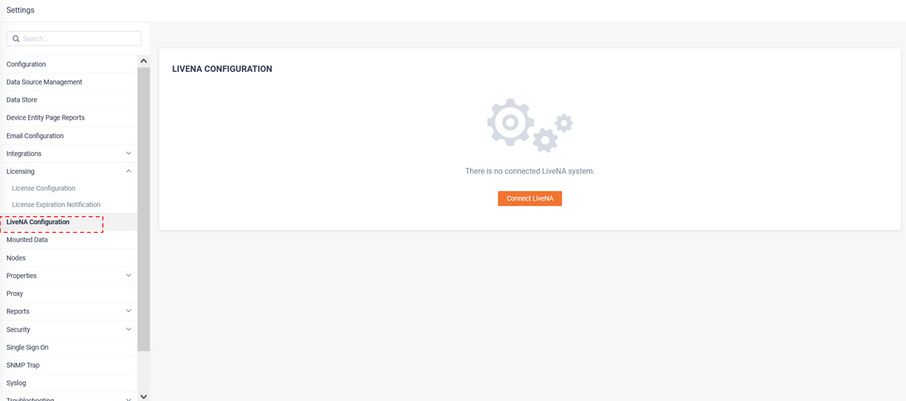
To Integrate LiveNX to a LiveNA, click .

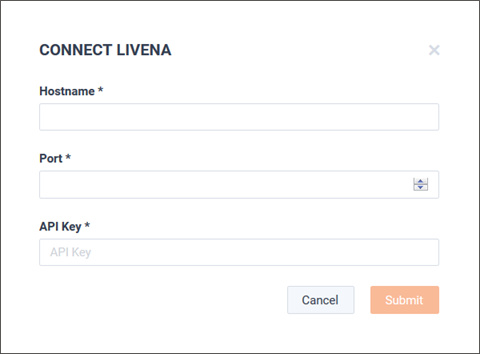
Add the LiveNA Hostname, Port, and API key and click .
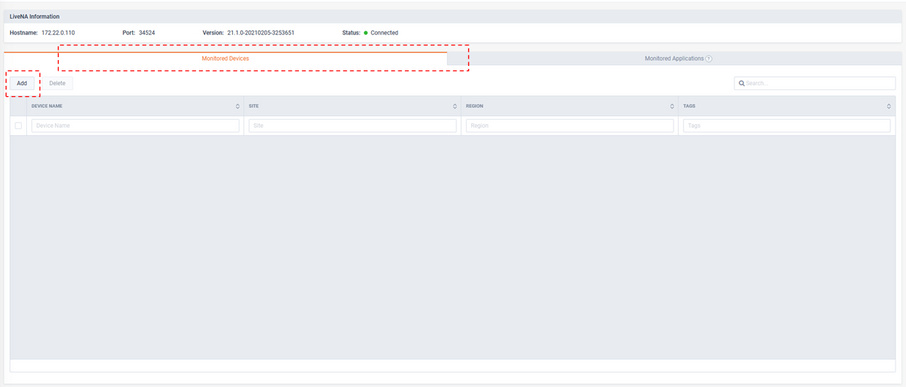
After the LiveNA connection has been established, LiveNA will need to be configured with which devices in LiveNX’s inventory it needs to monitor. To add devices for LiveNA to monitor, from the Monitored Devices tab click .
The Add Devices modal appears, select the devices of interest and click .
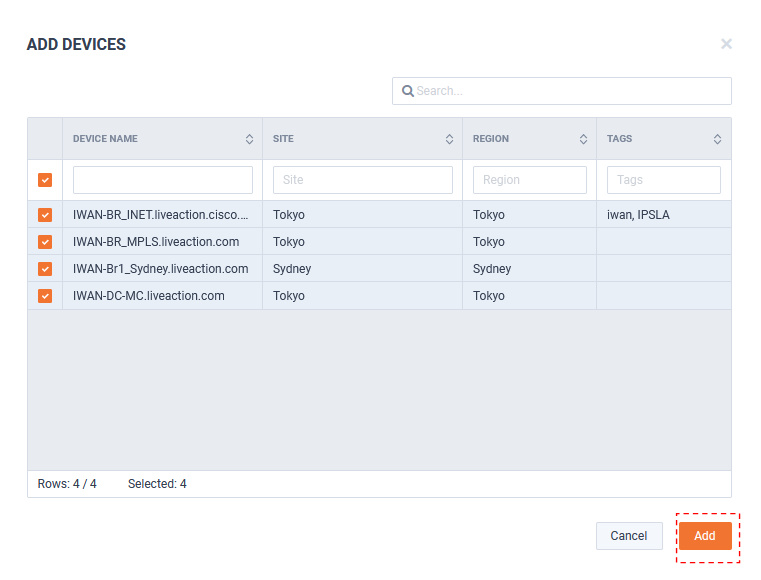
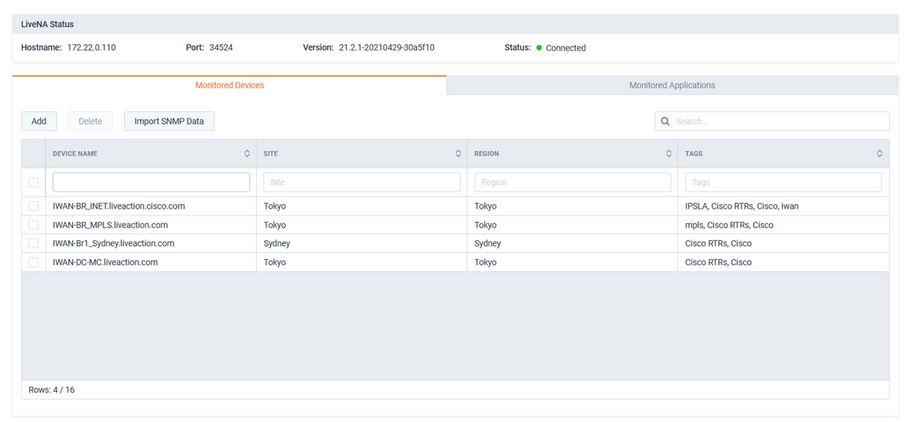
The selected devices appears on the Monitor Devices tab.
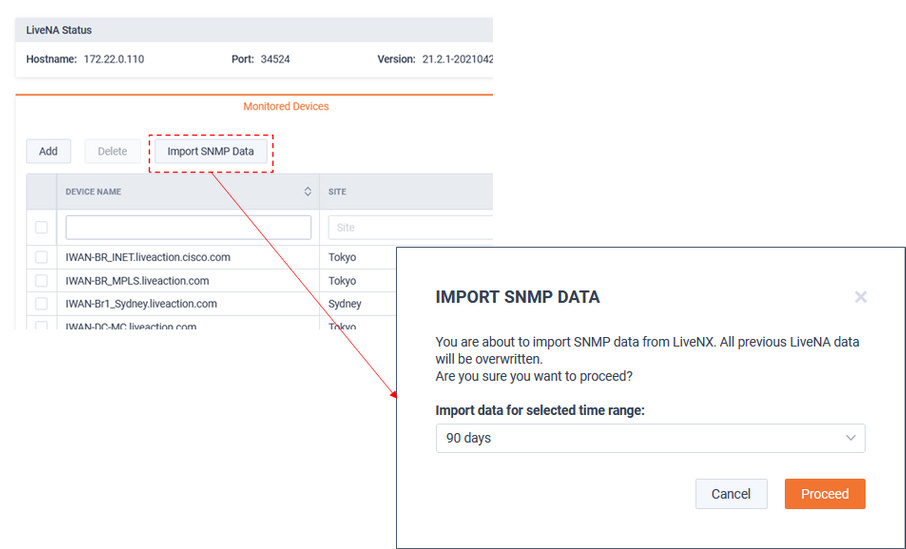
The button can be used for LiveNA to query and import any relevant historic device data that is available from LiveNX. This will allow LiveNA to immediately provide value for SNMP use cases as it can learn and trend the patterns of this historic data.
By default, LiveNA will learn and monitor the top 100 application on the devices it is monitoring. This is based on network utilization. These top 100 could change over time. To ensure LiveNA residually monitors key applications of interest, Application Groups can be added to the Monitored Applications tab. These will be monitored in addition to the auto-learned top 100 applications. To add an Application Group, from the Monitored Applications tab, click .
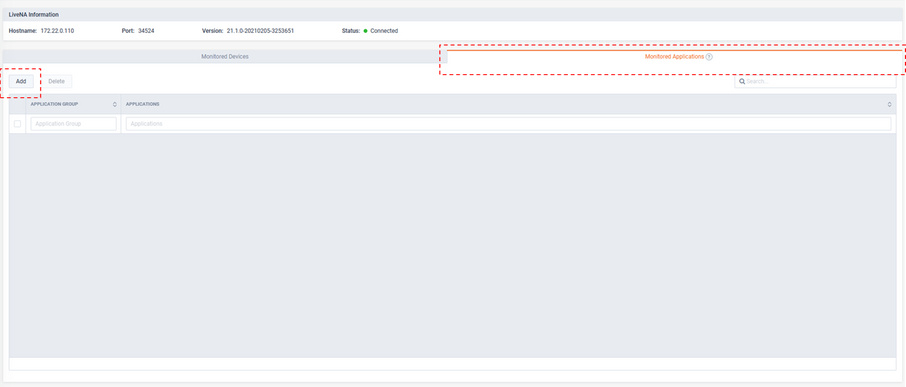
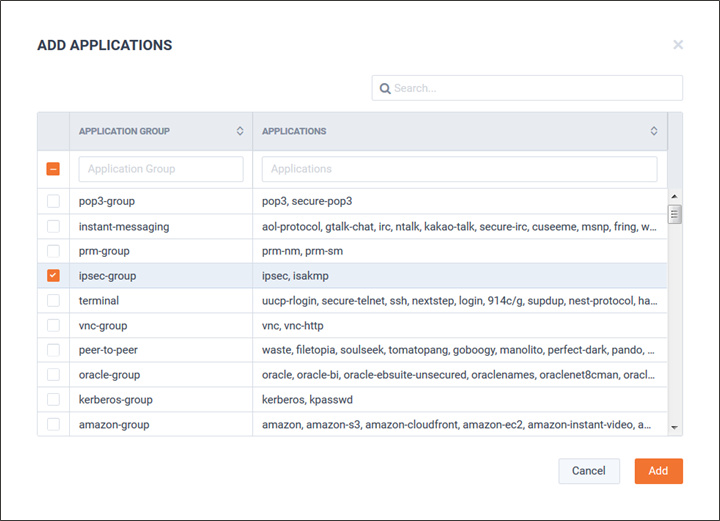
The Add Applications modal appears and lists the Application Groups defined in LiveNX. Select an Application Group and click .
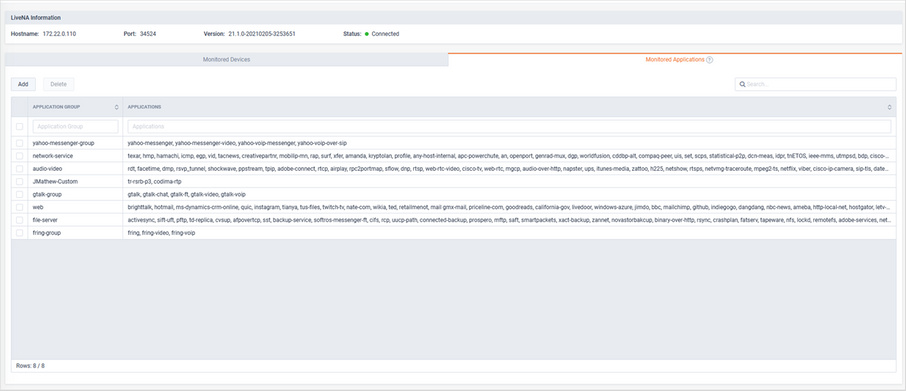
The selected Application Groups will be listed on the Monitored Applications tab.
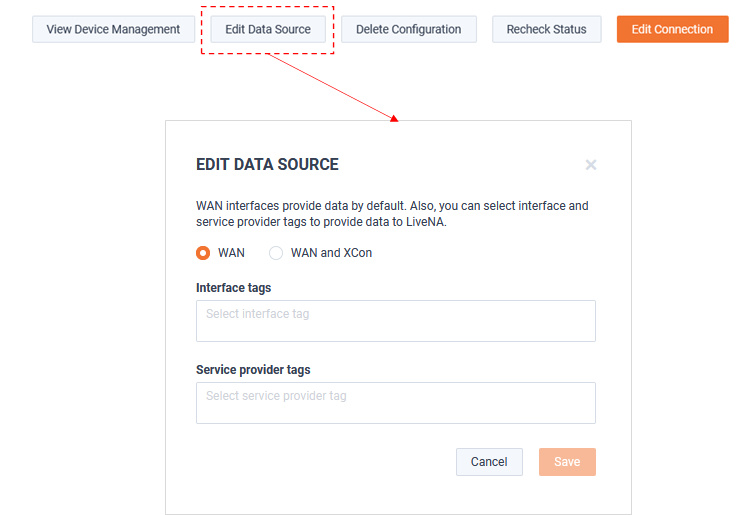
The button allows customization of which interfaces LiveNA will monitor for its baselining and predictive use cases.
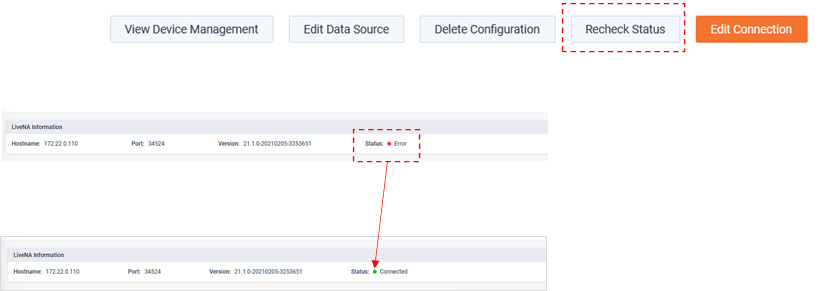
The button ensures LiveNX is in sync the latest health of LiveNA.
