Lan Reports
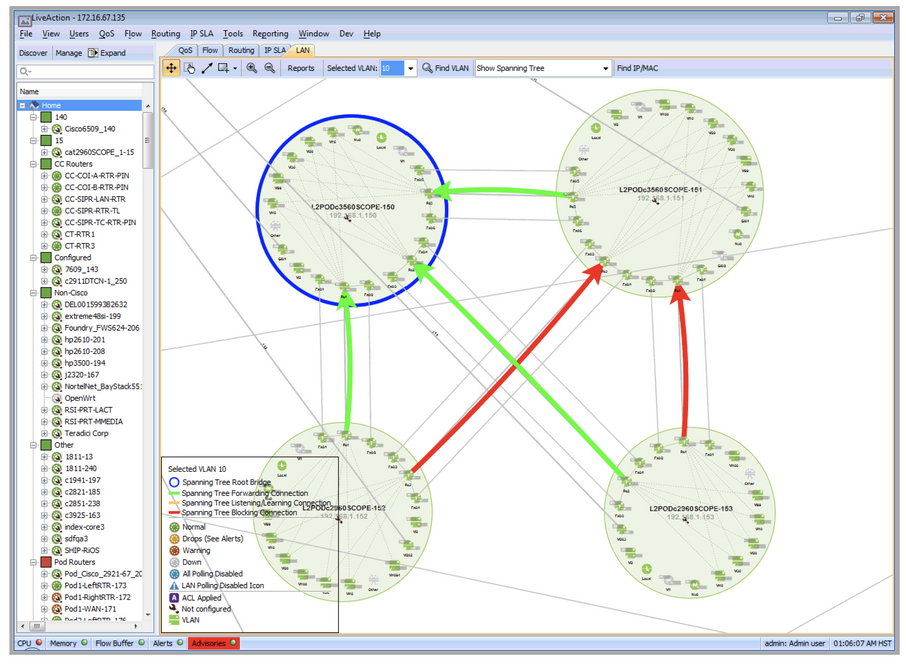
LAN reports provide detailed results on the bandwidth, drops and spanning tree state for both the entire system and for individual devices. The LAN reports can be accessed by clicking on either the Reporting > LAN > LAN Reports. LAN Reports can be accessed by the Reports button in the toolbar in the LAN tab. The image below shows where the Reports button is located in the LAN tab.

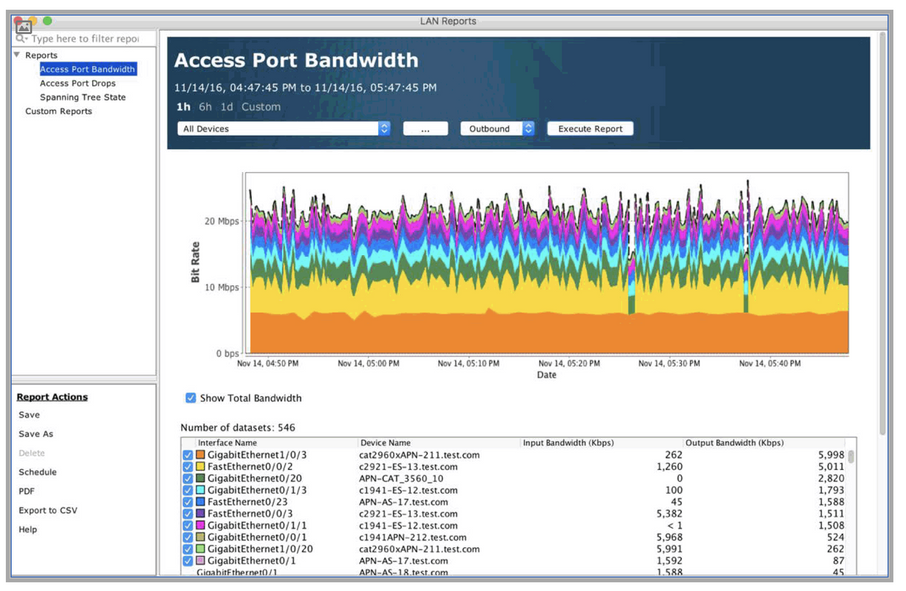
LiveNX provides three reports as shown in the list at the top left-hand side in the window below: Access Port Bandwidth, Access Port Drops and Spanning Tree State. For the access port reports, the length of historical data is selectable at the top of the chart: 1h (last hour), 6h (last six hours), 1d (last day) and Custom. When selecting Custom, the select the desired Start Time and End Time for the LAN Report. The image below shows a Device Bandwidth chart with a time span of one hour. When choosing the Access Port Bandwidth report, select the desired device and Inbound or Outbound using the two respective combo boxes. Click on the Execute Report button to display the desired data. The table accompanying the chart describes the access ports and their input and output bandwidths in Kbps. Specific access ports can be viewed in the chart by enabling or disabling them via the check boxes next to their names in the table.

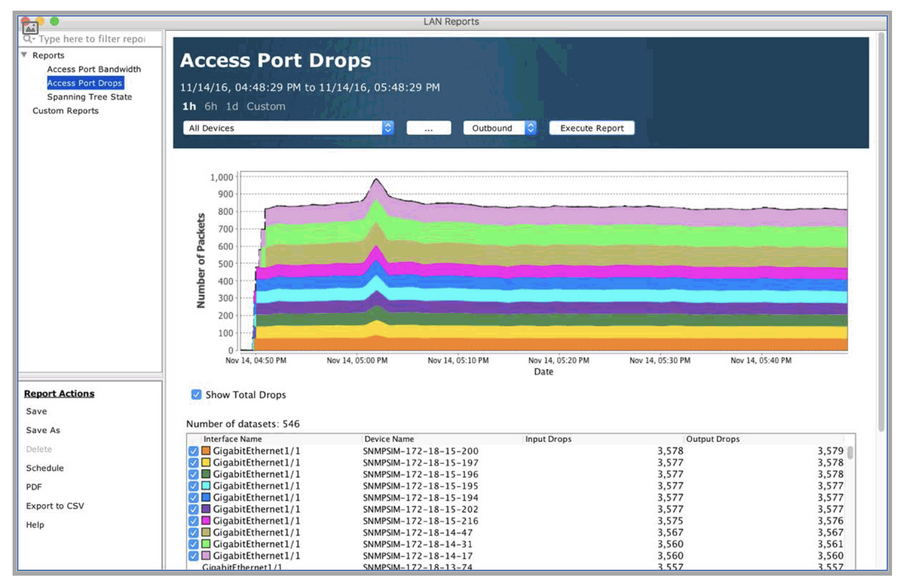
When choosing the Access Port Drops report, select the desired device and Inbound or Outbound using the two respective combo boxes. Click on the Execute Report button to display the desired data. The table accompanying the chart describes the access ports and the number of packets dropped in both directions in the desired timeframe.

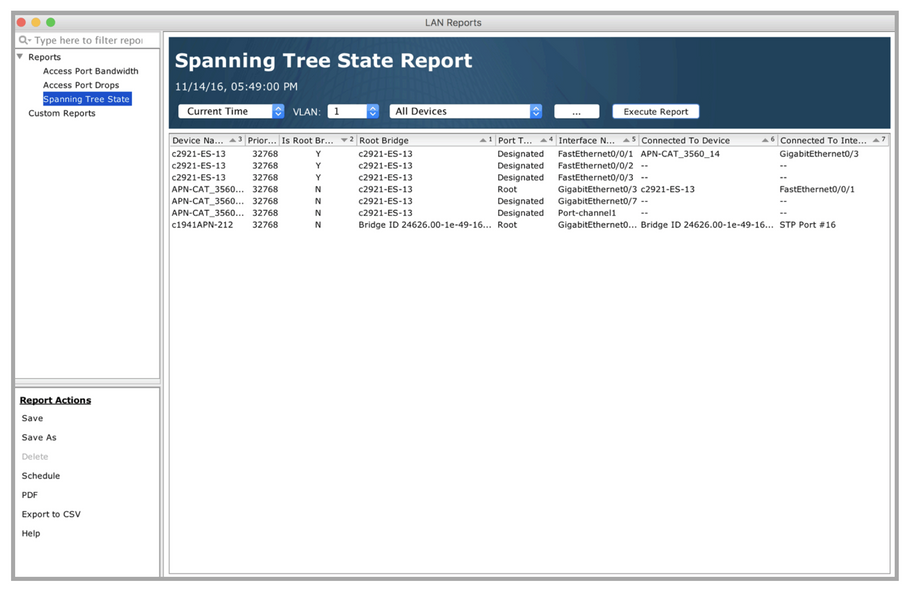
When choosing the Spanning Tree State Report, select the desired time, VLAN and either All Devices or a specific device using the dropdown menu. Click on Execute Report to display the desired data.
NOTE: The Spanning Tree State Report tabulates information at a specific point in time and not over a time period. The Spanning Tree State Report is not available as a Scheduled Report.

The Access Port Bandwidth and the Access Port Drops reports include a … labeled button. Click to display a device pick list with an alphanumeric entry for searching the list. For more details on the device pick list, please see the Device Pick List section in the QoS reports. Custom reports can be created using the Save or Save As button. Once a desired report is saved, the report name appears in the Custom Report list. After a custom report is created, it can be scheduled using the report scheduling feature. There are six buttons for the LAN reports: Save, Save As, Delete, View HTML, Export to CSV, and Help. These buttons work the same way as the ones for the QoS and routing reports.