Signal statistics
Signal statistics display continuously updated graphs of wireless traffic signal strength. When a supported wireless adapter is selected as the capture adapter, signal statistics are available for a capture window.
To view Signal statistics:
• Click the Signal view in the navigation pane of a capture window.
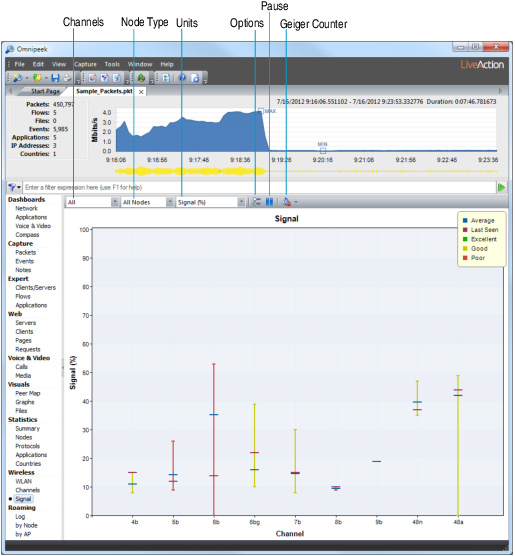
The parts of the Signal view are identified below.

• Channels: Choose to show signals on all channels or show only the signals of access points detected on the channels advertised in AP beacon and probe response packets.
• All: Shows the minimum, maximum, average, and most recent values for each channel in the scan.
• AP only: Shows the most recent value for each AP.
• Node Type: Limits the display to traffic between certain types of nodes (All Nodes, Client to AP, AP to Client, or AP to AP).
• Units: Choose the units of display. The % (percent) units show the RSSI (Receive Signal Strength Indicator), normalized to a percentage. The dBm units are expressed in decibel milliWatts.
NOTE: If the current adapter does not support dBm reporting, the Signal view will show readings of zero when any choice including (dBm) is selected for the Units. Change the Units to percentage (%) for these adapters.
• Options: Opens the Signal Statistics Options dialog, where you can choose to Reset graph occasionally or to toggle the Legend in the Signal view on or off.
• Pause: Temporarily suspends the update of the display.
• Geiger Counter: Acts as toggle. When enabled, makes an audible click each time the user-specified number of packets is processed on the selected adapter. You can specify a click for each 1, 10, 100, or 1000 Packets.